

How to Interpret the TradingView Stock Heatmap: A+ Guide
For educational and information purposes only; not investment advice. Any Spartan Trading Service offered is for educational and informational purposes only and should not be construed as a securities-related offer or solicitation, or be relied upon as personalized investment advice.
Visual tools are becoming essential in stock market analysis, where new traders often need help deciphering complex data. The TradingView stock heatmap is a dynamic solution, transforming intricate market data into an accessible, color-coded display. This powerful tool leverages data visualization to simplify market sentiment analysis and market cap insights, making it easier for traders to grasp fluctuations in forex, crypto, and other volatile markets without overwhelming details.
At Spartan Trading, we specialize in providing timely and strategic advice for trading stocks and options. We harness the power of tools like the TradingView stock heatmap to enhance our decision-making processes. This visual tool integrates seamlessly into our strategy, allowing us to monitor market sentiment and adjust our watchlist efficiently. We aim to make trading accessible, ensuring our community can leverage data visualization effectively.
Through our explorations and comprehensive analysis, we’ve compiled this guide that dives deep into the TradingView stock heatmap. Our guide covers setting up your watchlist, interpreting color schemes based on market cap, and analyzing market sentiment over various timeframes. Afterward, you will understand how to effectively tailor the heatmap’s parameters to track and analyze your specific trading interests.
Let’s dive in!
What is the TradingView Stock Heatmap?
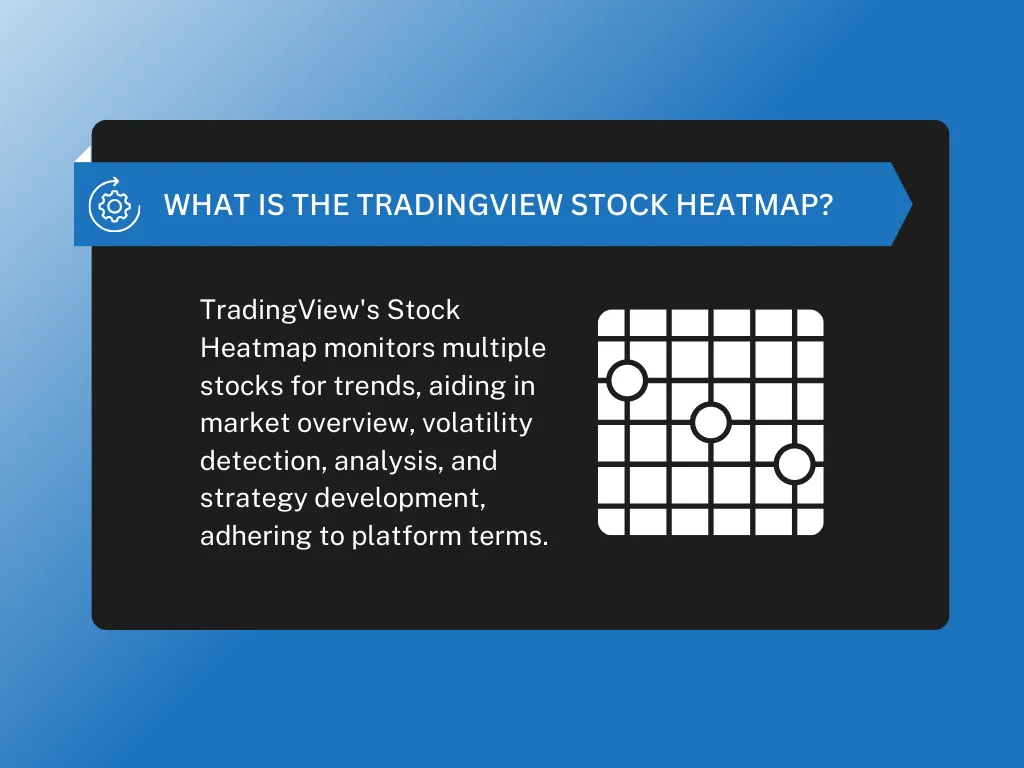
The TradingView stock heatmap is a visual tool traders use to monitor multiple stocks simultaneously. It employs a color parameter that indicates changes in stock values, making it easy to identify trends and outliers. This heatmap updates in real-time, showing how stocks perform throughout the trading day.
Here are the use cases of the TradingView stock heatmap:
- Market Overview: Quickly assess the overall market conditions. A green-to-red gradient shows which sectors or stocks are performing well and which are not.
- Volatility Detection: Identify stocks with high volatility. Colors intensify as price fluctuations increase, helping traders spot potential opportunities or risks.
- Comparative Analysis: Compare the performance of stocks within the same sector or across different ones. This helps in making informed decisions based on sector strength.
- Historical Data Review: Track how stocks have performed over time. Adjust the timeline to see past performance trends and how they correlate with current data.
- Investment Strategy Development: Develop and refine investment strategies based on visible trends and anomalies spotted within the heatmap.
At its core, the TradingView stock heatmap is an essential for traders who need to make quick, informed decisions. With functionalities like monitoring market volatility and comparing historical data, it provides various advice that aligns with the platform’s terms of use. This helps users optimize their trading strategies efficiently.
How to Interpret the TradingView Stock Heatmap
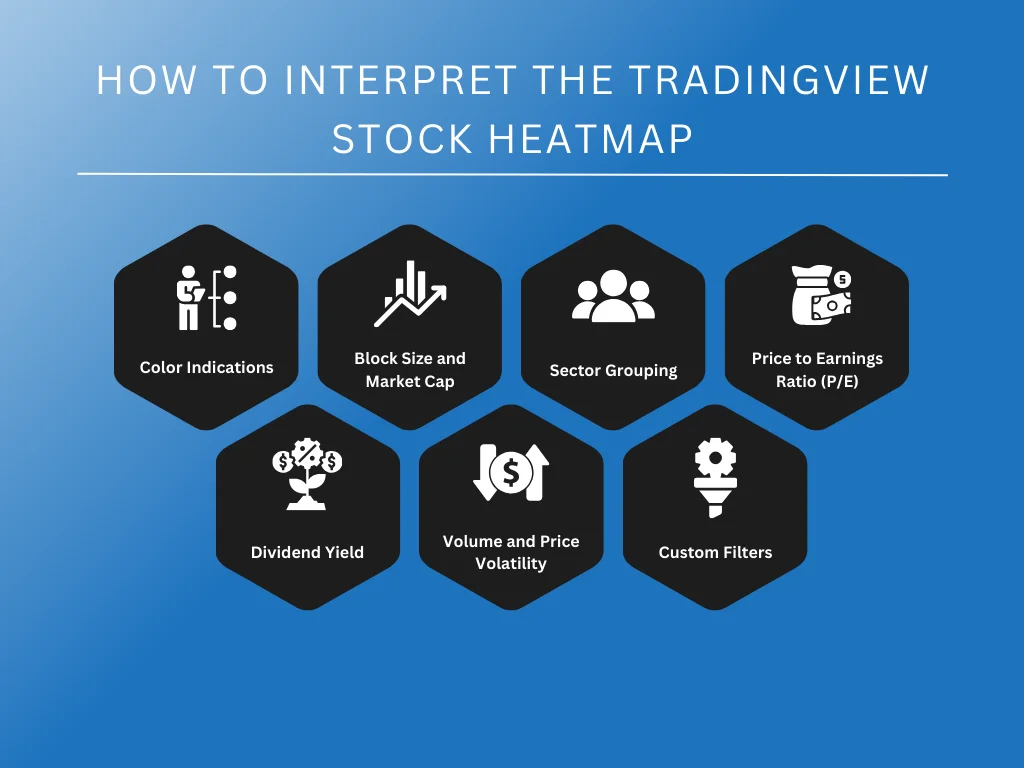
Understanding how to interpret TradingView stock heatmap allows traders to visually analyze market conditions quickly. This tool displays stocks in varying colors and sizes, indicating their performance and relevance within the market. Here’s how you can do it via different factors:
Color Indications
One of the most striking features of the TradingView stock heatmap is its use of color to indicate stock performance. Generally, shades of green represent positive changes or growth, while shades of red indicate negative movement. The intensity of the color varies with the strength of the stock’s performance. This immediate visual cue helps traders spot which stocks are outperforming or underperforming at any given time.
For instance, if Apple Inc (AAPL) shows a bright green block with a +1.09% increase, it signifies positive performance on that trading day. Conversely, a deep red block with a -1.92% indicates a drop in stock value. The intensity of the color reflects the magnitude of the change, providing an immediate visual cue about the stock’s daily performance.
Block Size and Market Cap
The size of each block on the heatmap relates to the company’s market capitalization. Larger blocks signify companies with a larger market cap, making it easy to spot the heavyweights in the market. This feature is crucial because movements in these stocks can have significant implications for the market sectors they represent.
For example, a giant block for Microsoft might indicate a market cap of approximately $1.5 trillion. In contrast, a smaller block for a company like Dropbox might represent a smaller market cap. This size differentiation helps traders quickly identify market leaders and assess their impact on the market.
Sector Grouping
TradingView heatmaps provide a view of stocks grouped by sector. This grouping offers a quick way to assess the overall health of specific industries. If most blocks in a sector show red, it might indicate an industry-wide issue or downturn, while predominant green could suggest a thriving or recovering sector. If the technology sector predominantly displays green, this suggests a general upward trend driven by a significant market event.
Price to Earnings Ratio (P/E)
The P/E ratio is a critical measure investors use to evaluate a stock’s valuation compared to its earnings. On the heatmap, you can adjust settings to reflect P/E ratios, allowing you to quickly see which stocks are potentially overvalued (higher P/E) and which are undervalued (lower P/E). This setup helps make informed decisions about buying or selling based on traditional valuation metrics.
For instance, a stock with a P/E ratio of 25 might indicate that the market expects future growth and is willing to pay a premium. Meanwhile, a stock with a P/E of 15 could be viewed as undervalued or correctly valued depending on the industry average.
Dividend Yield
For income-focused investors, dividend yield is a vital statistic. The heatmap can be configured to highlight companies with higher dividend yields, represented by larger blocks. This setup is beneficial for quickly identifying income-generating stocks.
On the heatmap, a stock like AT&T might appear with a larger block if set to reflect dividend yields, given its high yield of around 7%. This visualization helps investors quickly spot high-yield opportunities.
Volume and Price Volatility
Volume indicates the number of shares traded and can indicate the stock’s stability or volatility. High trading volumes sometimes correlate with significant price movements, which are crucial for day traders. The heatmap can be adjusted to show trading volume, providing insights into which stocks are most active.
As an example, if Tesla’s stock shows high volume on the heatmap, it could indicate significant interest or volatility, especially if it has moved by more than 3% in either direction. High volume often correlates with significant news or events affecting the company.
Custom Filters
TradingView heatmaps offer custom filters to hone in on specific criteria like price changes, volume, or P/E ratios. Using these filters, you can tailor the heatmap to display only the information relevant to your trading strategy, helping you focus on stocks that meet your investment criteria.
Watch our video to learn how to use a heat map strategically in day trading. Gain insights into stock data and market trends to enhance your trading decisions with this powerful tool.
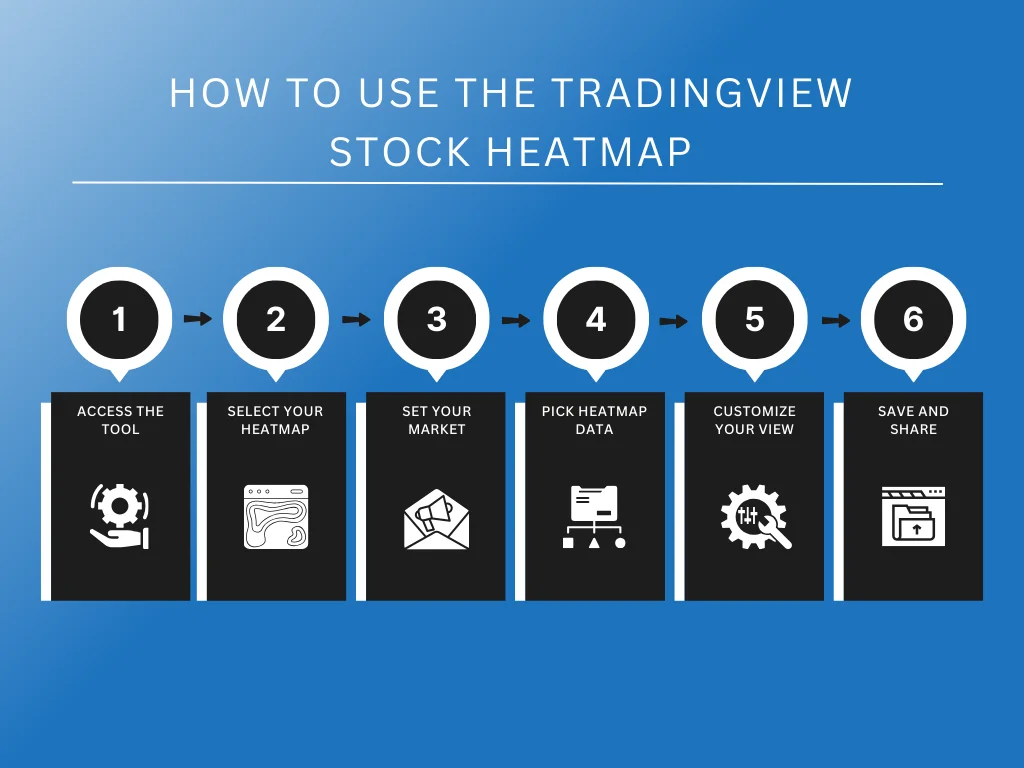
How to Use the TradingView Stock Heatmap
Understanding how to interpret and use the TradingView stock heatmap is crucial to make informed decisions in a dynamic market environment. Let’s explore the process of accessing and customizing this stock heatmap.
Step 1: Access the Tool
To begin using the TradingView stock heatmap, you need to first navigate to the TradingView website. Once there, you will find a user-friendly interface with a toolbar at the top of the screen. Look for the option labeled “Products” on this toolbar. This is your gateway to various screening tools that TradingView offers, which are crucial for performing detailed market analyses.
Step 2: Select Your Heatmap
After clicking “Products,” a dropdown menu will appear, presenting multiple options. These options include the Stock, Crypto, and ETFs heatmap. For the stock market analysis, select “Stocks.” This option explicitly targets stock markets, offering a comprehensive visual representation of various stocks’ performance.
Step 3: Set Your Market
Upon selecting the Stock heatmap, the default view will typically showcase the US market, which includes significant indices like the S&P 500, NASDAQ, and more. However, if your focus is different, you can easily change this. A source option is located in the top-left corner of the heatmap. Clicking this allows you to modify the market that the heatmap displays. This feature is particularly useful for traders interested in markets specific to certain countries or regions.
Step 4: Choose the Heatmap Source
When you click on the source option, a list will pop up, providing you with a selection of different market sources. These sources range from global indices like the Nifty 50 to more localized indices. Choose the source that best suits your trading needs. For instance, if you are an investor focusing on Indian markets, selecting the Nifty 50 would provide a heatmap tailored to your interests. Once selected, the heatmap will automatically update to reflect the data from your chosen source.
Step 5: Customize Your View
TradingView allows for significant customization to ensure that the heatmap meets your needs. You can customize your heatmap based on percentage changes, sectors, market capitalization, or performance. This customization is vital as it enables traders to view the market through a lens that fits their trading strategy and objectives. So, if you’re interested in large-cap stocks, you can set the heatmap to display only those stocks for a clearer view of stock performance.
Step 6: Save and Share
Once you have customized your heatmap, TradingView offers tools to save and share your heatmap. It includes a social sharing button to share your insights with the trading community or across your social media profiles. This is useful for personal reference and helps in discussions with fellow traders. Additionally, saving your settings allows you to revisit the same view without needing to redo the setup each time, saving time and ensuring consistency in your analysis.
Advantages of Using a TradingView Stock Heatmap
A TradingView stock heatmap offers a dynamic way to view complex stock market information at a glance. It provides immediate insights into market trends and sector performance, making it an invaluable resource for traders of all skill levels.
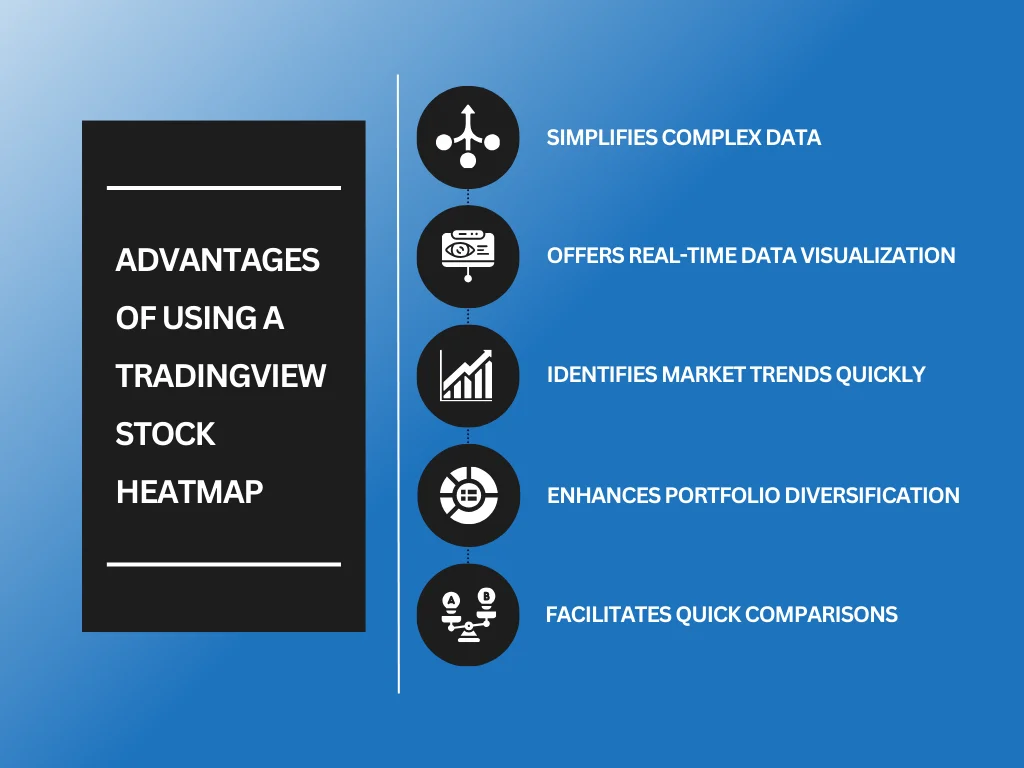
Here are five key advantages of using a TradingView stock heatmap:
Simplifies Complex Data
The primary advantage of a stock heatmap is its ability to simplify complex data. Stock markets involve thousands of stocks, which can overwhelm even the most experienced traders. A heatmap condenses this data into an easy-to-understand format. It uses colors to show which stocks are performing well and which are otherwise.
Offers Real-Time Data Visualization
Heatmaps on TradingView are updated in real-time. This allows traders to see immediate market movements as they happen. In fast-paced markets, having access to real-time data is crucial. It enables traders to react swiftly to market changes, capitalizing on opportunities or avoiding pitfalls. This immediate insight can be the difference between a profitable trade and a significant loss.
Identifies Market Trends Quickly
Another significant advantage is the heatmap’s ability to reveal overall market trends quickly. Instead of analyzing individual stock performances, traders can view entire sectors or the market as a whole. If a particular sector shows a uniform color, it indicates a trend. For example, a green swath across technology stocks may suggest a tech sector rally. This birds-eye view of the market helps traders identify and assess potential investment areas more effectively.
Enhances Portfolio Diversification
Diversification is a key strategy for managing investment risk. The TradingView stock heatmap can aid this strategy by highlighting the performance diversity across different sectors and stocks. It helps investors identify which sectors are underperforming and which ones are outperforming. With this information, traders can adjust their portfolios to include a healthier mix of assets, balancing risk and maximizing potential returns.
Facilitates Quick Comparisons
Heatmaps facilitate quick comparisons between stocks and sectors. This is particularly useful during earnings season or when major economic news hits the markets. Traders can instantly compare how different stocks or sectors react to the same event, which provides insights into which stocks are more resilient or sensitive to market changes. In turn, this helps for more informed investment decisions.
Key Takeaway
The TradingView stock heatmap is essential in modern trading, particularly when identifying long-term investment ideas. This visual tool helps traders assess which sectors and companies outperform or underperform. With its color-coded data and varying block sizes, the heatmap delivers immediate insights into market trends and stock strength, guiding traders toward more informed investment decisions.
However, ongoing learning and adaptation of new trading tools are crucial for staying ahead in the competitive trading world. As markets evolve, so must our strategies and tools. Traders need to engage with new technologies and trading resources consistently. This proactive approach sharpens skills and opens up opportunities for better returns.
Have questions about leveraging the TradingView stock heatmap for your trading strategy? Contact Spartan Trading to discuss your strategies and/or sign up for our newsletter. Here, you’ll gain free access to exclusive event access, promotions, weekly stock picks, and market outlooks. Our resources are designed to help you navigate the complexities of the market and build a successful trading portfolio.