


What is a Bear Trap? Stock Market Pattern to Know in 2024
Understanding the bear trap stock market phenomenon is crucial for traders and investors in 2024. A bear trap misleads participants into anticipating a decline in stock prices, only for the market to rebound, causing losses for those betting on a downturn. Anticipating and recognizing bear traps in the stock market can heavily impact your trading outcomes. It often results in a sharp upswing, turning potential gains into losses for those on the short side.
At Spartan Trading, we specialize in providing insights and strategies for navigating the complexities of financial markets, including the bear trap stock market. Drawing on our experience, we’ve noticed how short sellers, influenced by technical analysis and market sentiment, often find themselves caught in bear traps. We aim to help traders avoid such pitfalls, focusing on key support levels, trading volume, and price action to make informed decisions.
With years of expertise, we’ve compiled this guide that delves into the intricacies of bear trap trading, short selling, and the importance of stop-loss orders to prevent further losses. We will explore key characteristics of a bear trap pattern and how to discern a true trend reversal. Afterward, you’ll better understand how to navigate bear traps in the stock market, protect your investments, and capitalize on bullish trends and sharp flips.
Let’s get started!
What Is a Bear Trap? Stock Market In Day Trading
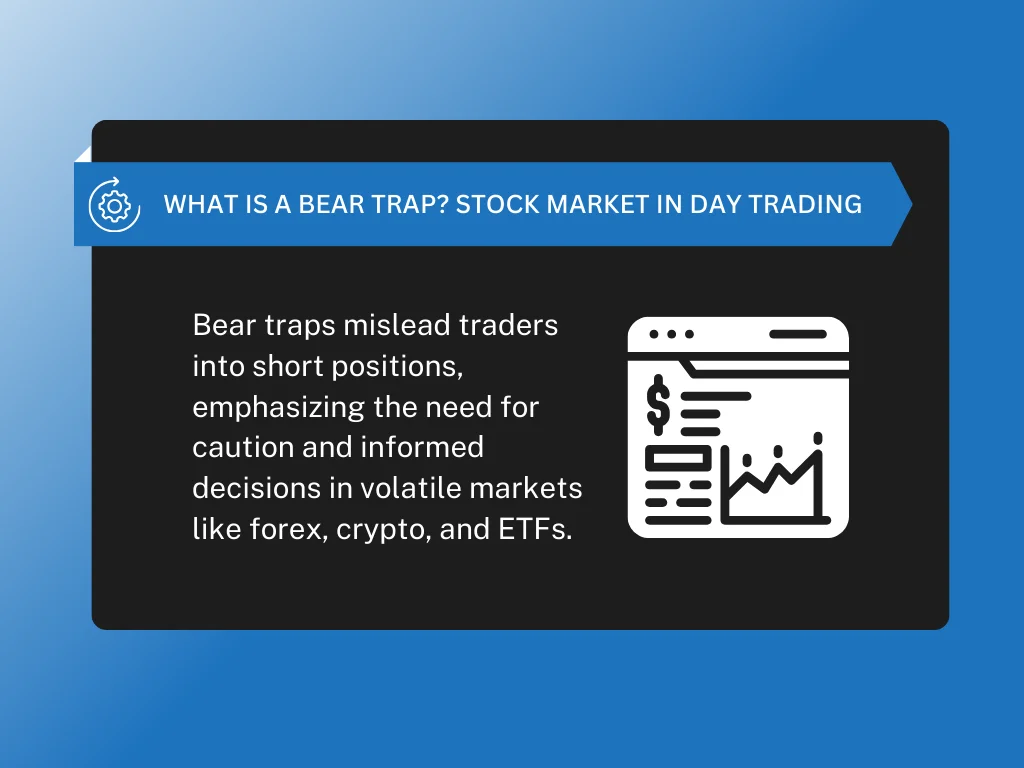
A bear trap stock market is a deceptive signal that indicates a downward trend reversal, enticing traders to take short positions based on a perceived continuation of a bearish trend. However, instead of further price decline, the market reverses, causing losses for those in short positions.
Recognizing a bear trap stock market pattern saves traders from premature entries in a downward trend, expecting new lows that never materialize. It emphasizes risk management’s importance and helps make informed decisions, clarifying potential pitfalls in volatile markets like forex, crypto, and ETFs.
Bear traps often occur due to several factors:
- Market Manipulation: Market makers or liquidity providers sometimes create a wide price range to trigger short sales, then drive the price upwards, causing a short squeeze.
- Technical Chart Misinterpretation: Traders misreading chart patterns, RSI, MACD, or Fibonacci levels might mistake a temporary dip for a beginning bear market, leading to incorrect short positions.
- Bull Trap Counteractions: Following a bull trap, investors might overreact to a slight uptrend reversal, entering short positions too early before the asset resumes its rise.
- Volatility and News: Unexpected news or events in the United States or globally can cause sudden volatility, leading to divergence from predicted trends.
- Psychological Trading Behaviors: Fear of missing out on a downtrend or panic selling in anticipation of a bear market lead investors to make hasty decisions without proper confirmation of resistance levels.
Understanding bear traps and incorporating appropriate risk management techniques into trading strategies is essential for navigating the stock market effectively. Always remember that this information does not constitute investment advice, and traders should conduct thorough research and consult with financial professionals before making investment decisions.
Key Characteristics of a Bear Trap Stock Market Pattern + Example
Learning the nuanced patterns that can signal major shifts is crucial for traders to successfully bet in the stock market trading. Here are characteristics of a bear trap that can help identify this deceptive pattern, leveraging it or not to your advantage:
Sudden Price Drop
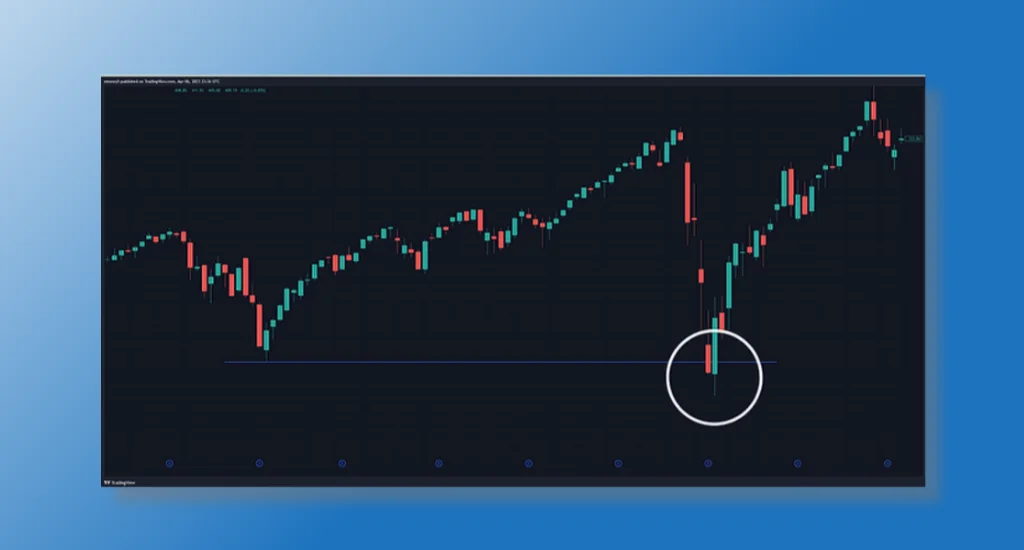
The bear trap stock market pattern initially manifests as a noticeable drop in share price or asset value. This decline suggests the onset of a downtrend, leading traders to anticipate further losses. Traders witnessing a sudden price drop may rush to short-sell, expecting the downtrend to continue. However, this initial drop is a classic bear trap, misleading investors about the market’s direction.
Here are factors indicative of a bear trap sudden price drop:
- Rapid Decline in Price: A sharp, unexpected fall in price triggers an alarm, suggesting a bearish trend.
- Increased Trading Volume: An uptick in trading volume accompanies the price drop as sellers offload shares and short-sellers enter the market.
- Short-Lived Downtrend: The downturn appears brief, with the price quickly stabilizing or even beginning to recover.
- Market Sentiment: Despite the drop, broader market indicators may not support a long-term bearish trend, indicating that the downtrend might not be as pervasive.
Recognizing a bear trap stock market pattern requires astute observation and understanding of market dynamics beyond initial appearances. The sudden price drop, while alarming, often does not lead to a sustained downturn.
Instead, it serves as a trap for bearish traders, who might be caught in an unexpected reversal of fortune as the market swiftly recovers. Awareness and caution can help traders navigate these deceptive waters, turning potential pitfalls into opportunities for strategic gains.
Short Selling Surge
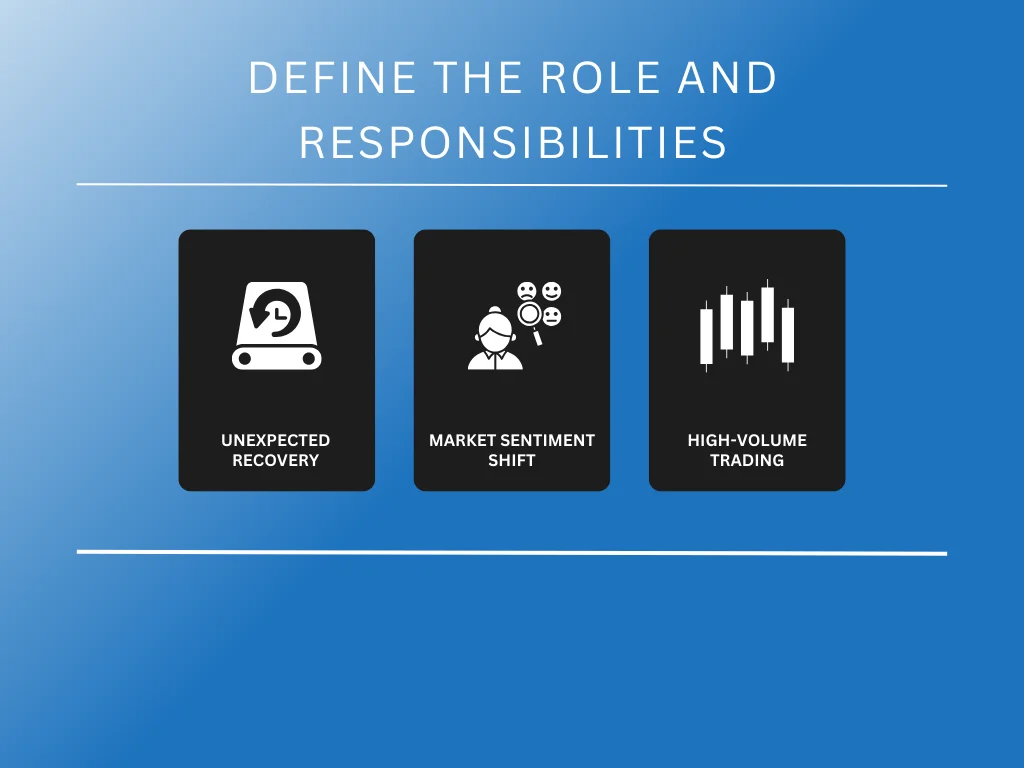
An initial price drop triggers a short-selling surge in the bear trap stock market. Traders, convinced that prices will continue to fall, bet against the market. This action is a hallmark of the bear trap setup, luring investors into a false sense of security. Here are the factors that trigger short selling surge:
- Unexpected Recovery: Following the short-selling surge, the stock unexpectedly rebounds. This quick recovery catches short sellers off guard.
- Market Sentiment Shift: News or market data that contradicts the bearish outlook can prompt a rapid change in sentiment, contributing to the rebound.
- High-Volume Trading: An increase in trading volume often accompanies the price recovery, indicating a strong buying interest that propels the market out of the bear trap.
For example, consider a scenario where a well-regarded tech stock experiences a sudden 10% drop due to a misleading news report. Short sellers jump in, expecting further declines. However, a swift correction in information leads to a rapid stock price recovery, trapping the short sellers.
A short-selling surge is a critical indicator of a bear trap in the stock market. Investors should watch for sudden, unexplained drops in stock prices followed by a rapid recovery. Recognizing these patterns can help traders avoid the pitfalls of bear traps and make more informed decisions.
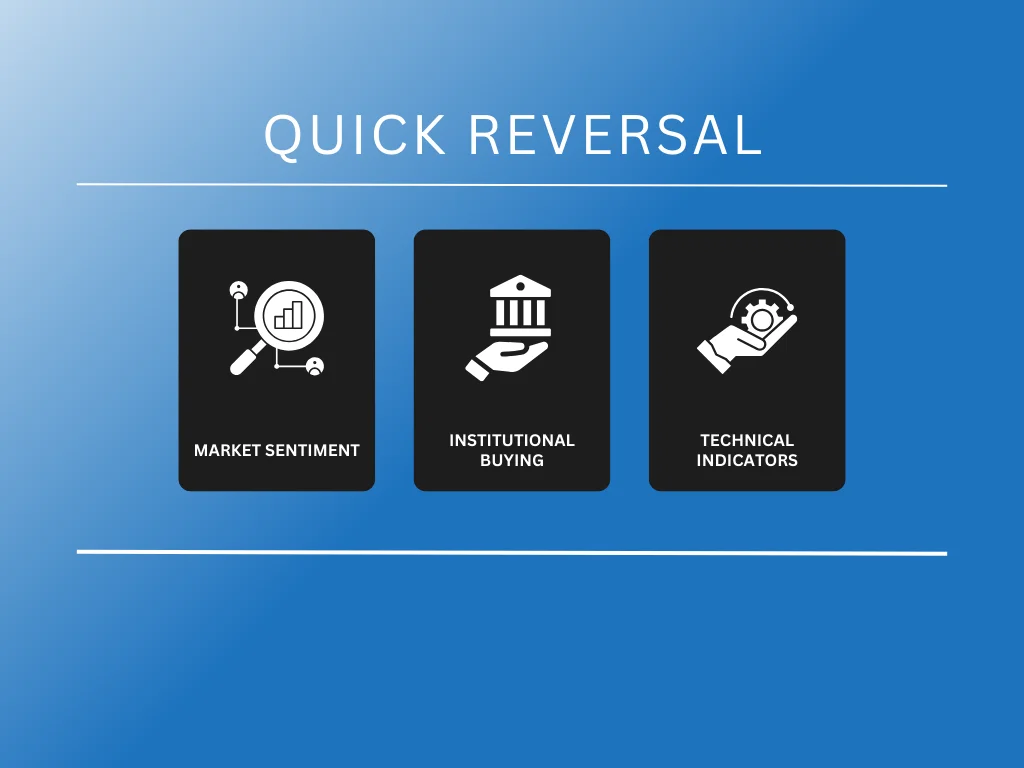
Quick Reversal
In the bear trap stock market scenario, traders anticipate a downturn, yet the market defies these expectations with a swift upward trend. This sudden shift catches many off guard, particularly those positioned for continued decline. A quick reversal bear trap is a stark reminder of the market’s unpredictability.
Here are the factors contributing to quick reversal:
- Market Sentiment: Often, a bearish outlook overshadows positive underlying factors, leading to an abrupt change as sentiment shifts.
- Institutional Buying: Large-scale purchases by institutional investors can reverse trends, propelling prices upward.
- Technical Indicators: Certain patterns and signals that suggest a bear trap stock market situation can mislead traders focusing solely on short-term movements.
Imagine a scenario where a tech stock experiences a slight decline after a period of steady growth. Traders predict a further fall and start short-selling. Suddenly, a positive earnings report surprises the market, causing the stock to recover and reach new highs. Those betting on the decline find themselves in a classic bear trap.
The quick reversal characteristic of a bear trap in the stock market underscores the importance of a comprehensive analysis beyond surface-level trends. It highlights the need for traders to remain vigilant, diversify strategies, and look for signs that defy the prevailing bearish sentiment. Recognizing and understanding these swift changes can prevent significant losses and turn potential traps into opportunities for gain.
Volume Spike
A key characteristic of a bear trap stock market, a deceptive signal suggesting a declining market is about to rebound, is a significant spike in trading volume. This sudden increase is pivotal. It signals that the downward trend may not continue, and a reversal is imminent. Traders often look for this spike as a confirmation that what might seem like a continued downtrend is, in fact, a bear trap.
Factors in volume spike:
- Sudden Interest from Large Investors: Large buyers entering the market can cause a sharp increase in volume, leading to a potential bear trap scenario.
- News Releases: Positive news or unexpected events can trigger increased trading activity, contributing to the volume spike seen in bear traps.
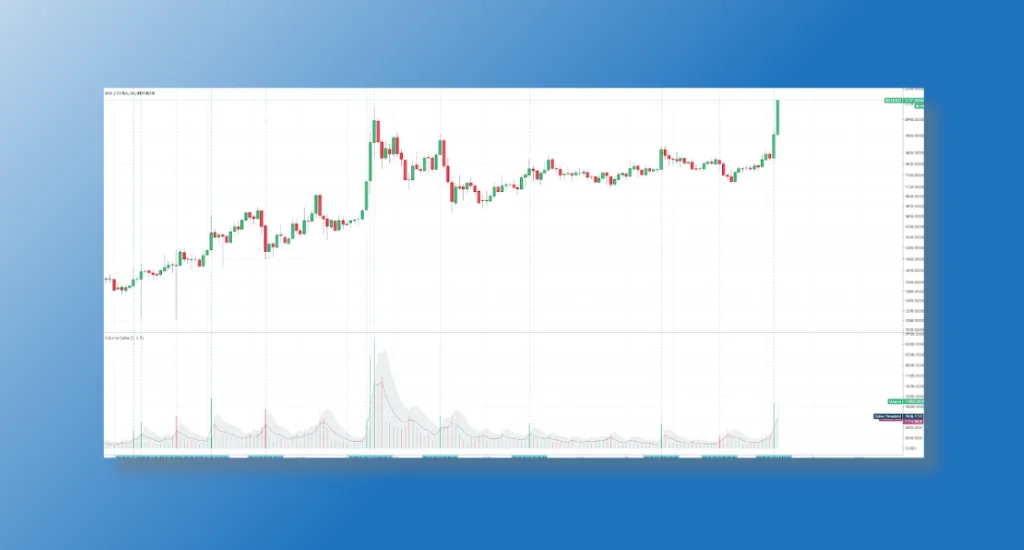
This spike in trading volume is illustrated by a tall, green volume bar, which corresponds with a large green candlestick on the chart. Such a volume spike suggests a substantial increase in trading activity. Typically, a spike like this could indicate a strong buyer interest at that price point, potentially signifying the start of a significant price movement.
The volume spike is a critical indicator within the bear trap stock market pattern, signaling traders to reconsider their positions. Recognizing this characteristic can prevent losses and turn potential traps into opportunities. Paying close attention to trading volume in conjunction with other market signals allows traders to navigate bear traps more effectively, turning what appears to be a market downturn into a strategic advantage.
Failure to Confirm the Downtrend
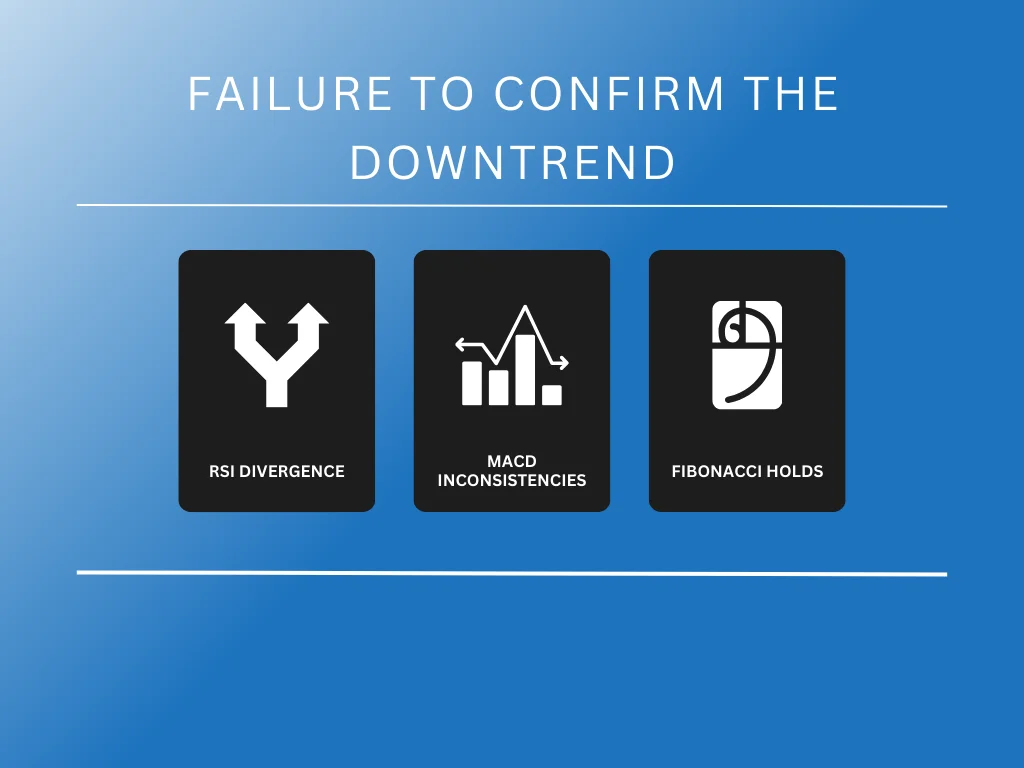
One of the defining characteristics of a bear trap in the stock market involves the failure of technical indicators to confirm an expected downtrend. Traders often rely on the RSI (Relative Strength Index), MACD (Moving Average Convergence Divergence), and Fibonacci retracement levels to gauge market momentum. However, in a bear trap scenario, these indicators may present conflicting signals:
- RSI Divergence: Instead of reflecting increased bearish momentum, the RSI might start to diverge, indicating a weakening of the downward trend.
- MACD Inconsistencies: The MACD may fail to show the anticipated bearish crossover, suggesting that the selling pressure is not as strong as previously thought.
- Fibonacci Retracement Levels Hold: Prices may unexpectedly find support at key Fibonacci levels, hinting at a potential reversal rather than the continuation of a downtrend.
For example, consider a scenario where a stock experiences a sudden dip. Traders might expect this to be the start of a prolonged bearish phase and begin short-selling based on initial technical analysis. However, the stock price quickly rebounds and breaks past previous support levels. In that case, it becomes evident that the bearish signals were misleading, thus characterizing a classic bear trap stock market pattern.
Recognizing these signs is crucial for traders aiming to navigate the bear trap stock market successfully. It requires a keen understanding of technical analysis and awareness of how these indicators can sometimes lead to false signals. This understanding can protect investors from premature decisions in what appears to be a bearish market but is, in reality, setting the stage for a bullish reversal.
How to Avoid a Bear Trap
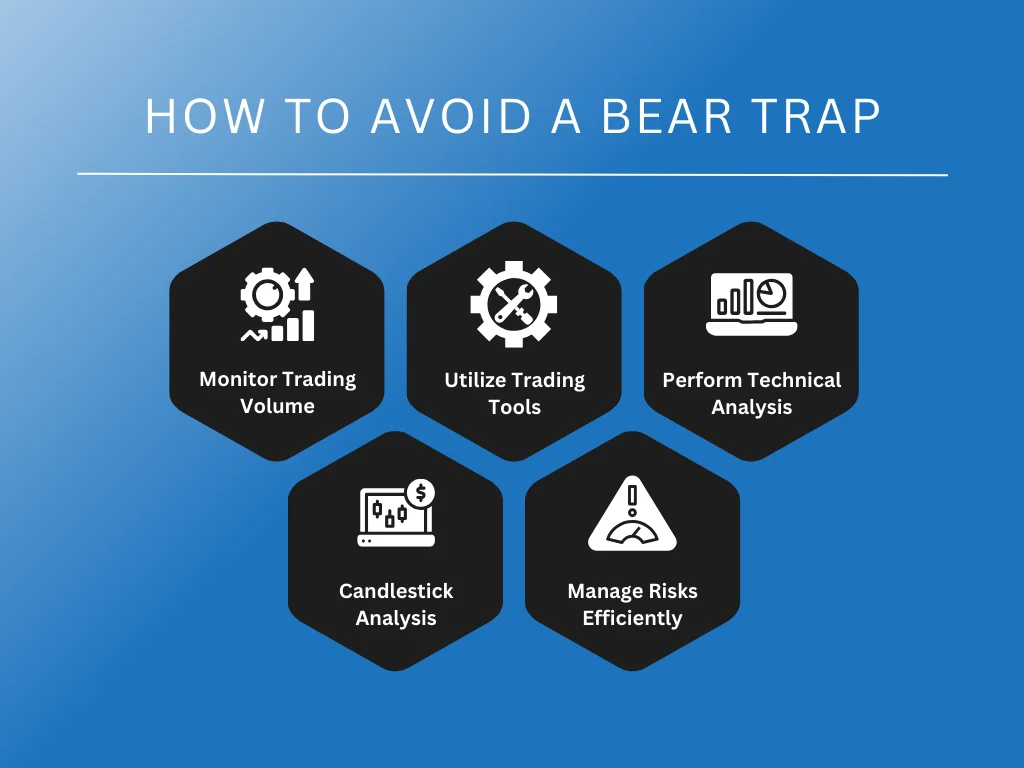
Navigating the stock market demands skill and caution, especially when avoiding the notorious bear trap stock market phenomenon. A bear trap can cause significant financial losses for traders betting on a continuing downtrend that never materializes. Here are strategies to help you avoid bear traps, leveraging it or not to your advantage:
Option 1: Observe Trading Volume Carefully
Trading volume is a critical indicator of a stock’s potential future movement. A downtrend usually accompanies increased trading volume as more traders sell off their stocks. Conversely, a bear trap features a price drop with relatively low trading volume, indicating a lack of sell-off and a temporary price drop. Monitoring volume provides clues behind the probability of price movements, helping traders differentiate between a real downtrend and a potential bear trap.
Option 2: Leverage Your Trading Tools Effectively
Modern trading platforms offer many tools and indicators to help predict market movements and identify bear traps. Tools like moving averages, RSI (Relative Strength Index), MACD (Moving Average Convergence Divergence), and Fibonacci retracements give insights into market trends and momentum. Traders can better assess whether a price drop is likely to continue or reverse, enabling them to make more informed decisions and avoid bear traps.
Option 3: Conduct a Thorough Technical Analysis
Technical analysis involves studying patterns, technical charts, and historical data to forecast future price movements. Recognizing patterns, such as candlestick formations or support levels without follow-through, can alert traders to exercise caution and evade stock market bear traps. Performing technical analysis helps understand the price range in depth, identifying potential reversal points, and distinguishing between genuine downtrends and misleading bear traps.
Option 4: Utilize Candlestick Indicators Wisely
Candlestick patterns are valuable for spotting immediate price action cues that may signal a bear trap. Patterns like the hammer, inverted hammer, or bullish engulfing can indicate potential reversals from a downtrend to an uptrend. Paying attention to these indicators, especially after a significant price drop, can warn traders of a possible bear trap, suggesting that it might be prudent to hold off on opening new short positions.
Option 5: Implement Risk Management Strategies
Risk management involves setting stop-loss orders to limit potential losses. It manages position sizes to avoid overexposure and diversifies holdings to reduce the impact of any single investment’s adverse movement. Understanding the dynamics of bear traps and incorporating risk management principles can help traders navigate through volatile markets, protecting them from sudden and unexpected price reversals.
Key Takeaway
Understanding bear traps in stock market trading is crucial to deal with the ups and downs of market movement. A bear trap stock market misleads traders into anticipating a sudden decline in stock prices, only for those prices to rebound sharply. Recognizing these traps prevents significant losses and enhances strategic decision-making. With the right knowledge, traders can identify the early signs of a bear trap, making it easier to sidestep potential pitfalls.
Staying resilient and adaptable is key when market manipulations like bear traps are at play. Traders who adapt quickly to unexpected market movements or sudden spikes in stock value ensure they can pivot strategies quickly. This adaptability safeguards their investments and opens up new opportunities for growth and learning.
At Spartan Trading, we help traders thrive in any market condition. We offer a swing trading program, masterclass trading education, and support during and outside market hours. Our team empowers traders to be proactive with the bear trap stock market. Contact us today to be part of our community, valuing resilience, adaptability, and continuous learning amidst stock market volatility.