


Cup and Handle Pattern: How To Identify and Analyze It
Understanding chart patterns in trading forms a crucial part of technical analysis. Among these patterns, the cup and handle pattern stands out for its popularity and effectiveness. This chart pattern represents a bullish continuation pattern, often seen in the stock market. Recognizing how this pattern forms on a price chart helps traders make informed trading decisions.
Spartan Trading, an online stock and option idea generation service, helps traders identify profitable trading opportunities. We specialize in technical analysis and provide insights into various chart patterns. We guide traders through the nuances of the stock market, ensuring they understand the depth of the cup, handle formation, and the right side of the cup. Our focus remains on maximizing gains during bullish trends and managing risks effectively.
Leveraging our extensive experience, we’ve assembled this guide to explore the cup and handle patterns. We will cover the pattern’s basic structure, identification, analysis, trading strategies, and limitations. Ultimately, you’ll understand how to spot the rounded bottom, recognize the handle formation, determine the entry point, and set a target price. We will help you understand this pattern to enhance your trading skills.
Let’s jump in!
What Is a Cup and Handle Pattern
A cup and handle pattern is a bullish chart pattern that signals a continuation of an uptrend. This pattern consists of a rounded bottom and a short consolidation period, forming the cup. Learning about the pattern’s movement helps traders identify potential long positions when the stock’s price breaks resistance.
The basic structure of such a pattern involves several vital elements. The cup forms with a rounded bottom, resembling a “U” shape. Traders should look for the cup formation to identify potential buying opportunities and trend reversals. Here are the three main parts of the cup and handle pattern that traders should consider looking for:
- Sides of the Cup: The cup forms as the price of an asset moves in a U-shape.
- Bottom of the Cup: The lowest point, indicating a support level.
- Handle: A consolidation period after the cup, leading to the breakout point.
The cup and handle pattern offers a reliable technical indicator for predicting breakouts. Identifying the bottom of the cup, consolidation period, and breakout point helps traders set their buy point and manage risks. This bullish pattern proves effective in both stock and crypto markets.
How to Identify and Analyze a Cup and Handle Pattern
Understanding the cup and handle pattern can enhance your trading strategy. This chart pattern indicates bullish continuation and potential profit opportunities. To identify and analyze the pattern effectively, traders typically look for specific criteria in price movements and volume patterns, aiding in decision-making for potential trades.
Identify the Cup and Handle Pattern
Identifying this pattern is important for traders seeking bullish continuation signals. Here are the essential steps to spot this pattern effectively:
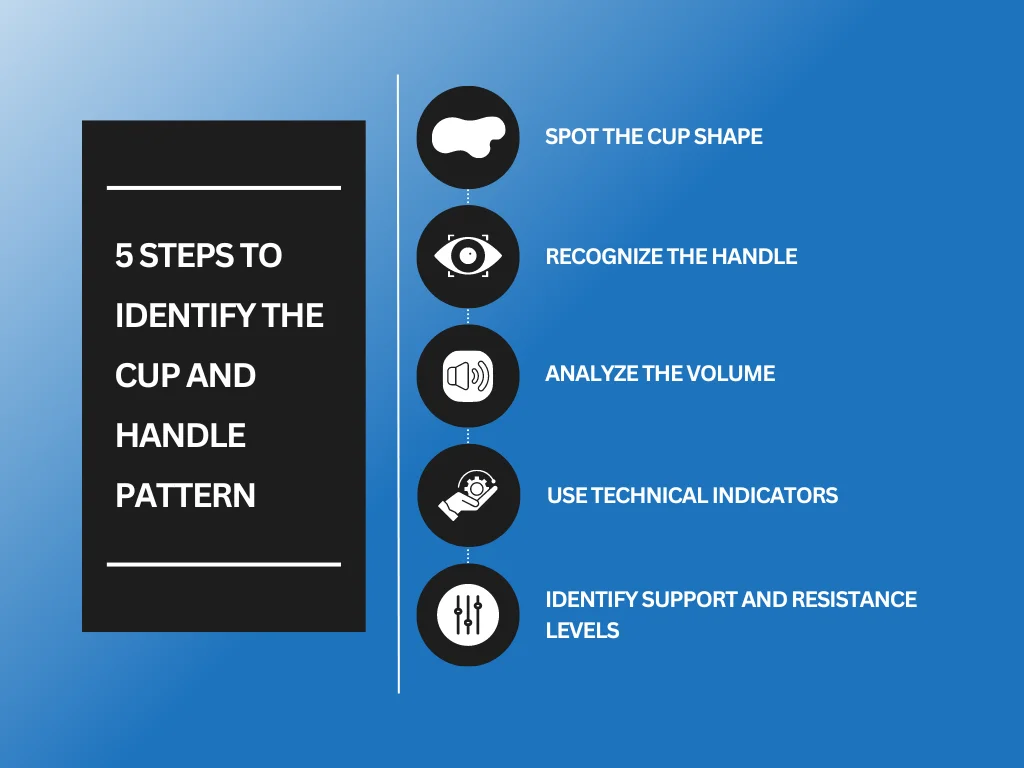
- Spot the Cup Shape: Look for a U-shaped formation that resembles a teacup. The cup should have a rounded bottom, as a V-shaped bottom often suggests instability and less reliability. The two sides of the cup should be at a similar height, indicating the resistance level.
- Recognize the Handle: After the cup forms, observe a slight pullback or consolidation that resembles a handle. This handle typically slopes downward or moves sideways, briefly consolidating before the breakout. The handle should not fall below the midpoint of the cup. If it does, the pattern may fail.
- Analyze the Volume: Volume often decreases during the cup’s formation and rises again when the handle forms. High volume at the breakout point confirms the pattern and suggests a strong buying interest. Watch for volume spikes to validate the breakout.
- Use Technical Indicators: To confirm the trend, utilize moving averages, such as the 50-day and 200-day moving averages. The cup should form above these averages, indicating a bullish trend. Additionally, check the relative strength index (RSI) to ensure the stock is not overbought or oversold.
- Identify Support and Resistance Levels: The cup’s two highs represent the resistance level. The bottom of the cup and the handle’s low point serve as support levels. Monitor these levels closely to confirm the pattern and anticipate potential price movements.
Analyze the Cup and Handle Pattern
Analyzing the cup and handle pattern involves detailed scrutiny to ensure accurate trading decisions. Here are the critical steps to analyze this pattern:
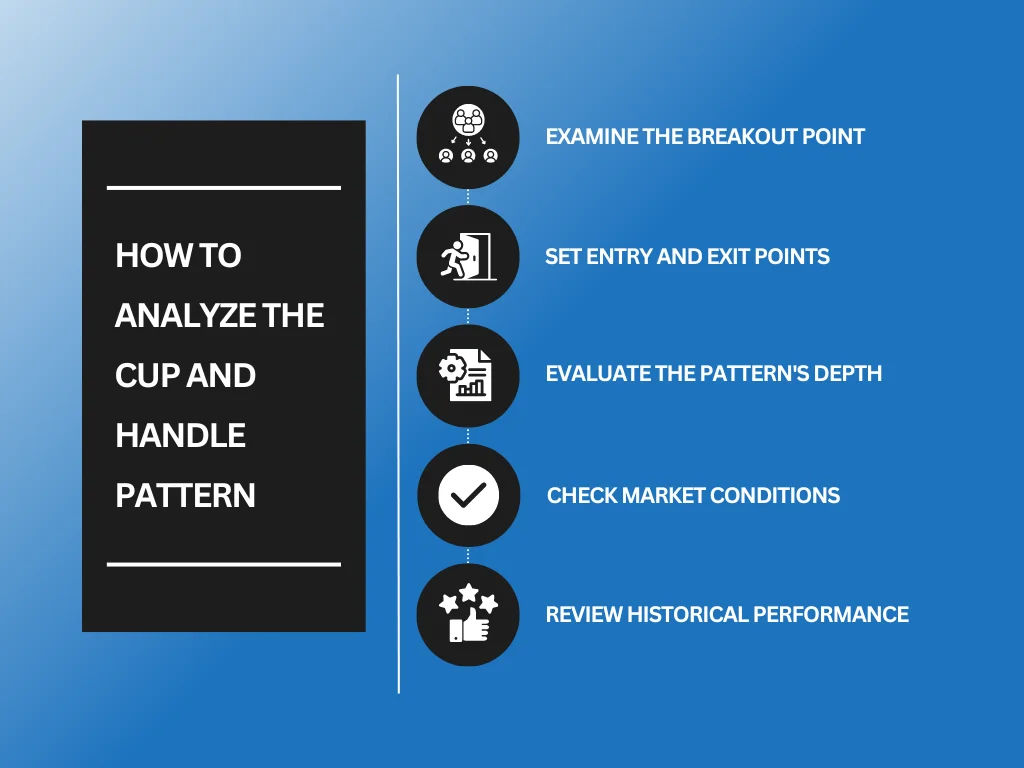
- Examine the Breakout Point: The breakout point occurs when the price moves above the resistance level established by the cup’s highs. A confirmed breakout often signals a continuation of the bullish trend. Ensure the breakout happens with increased volume for greater reliability.
- Set Entry and Exit Points: To capitalize on the upward momentum, determine your entry point at or slightly above the breakout level. To manage risk, set stop-loss orders below the handle’s low. Consider your risk/reward ratio when determining these levels.
- Evaluate the Pattern’s Depth: The cup’s depth can indicate the breakout’s potential strength. A shallower cup suggests a stronger trend continuation, while a deeper cup may indicate a longer consolidation period. Analyze the depth with other factors to assess the pattern’s reliability.
- Check Market Conditions: Ensure favorable market conditions before relying on the pattern. A bullish market environment increases the pattern’s success rate. Conversely, a bearish market can lead to false signals and failed breakouts.
- Review Historical Performance: Look at historical data and past occurrences of the cup and handle patterns. Analyzing previous patterns can help you understand potential outcomes and refine your trading strategy. Historical performance provides valuable insights into the pattern’s reliability.
- Combine with Other Analysis Tools: Use other technical analysis tools to validate the pattern. Fibonacci retracement levels, Bollinger Bands, and other indicators can provide additional confirmation. Combining multiple tools enhances your analysis and reduces the likelihood of false signals.
Types of Cup and Handle Patterns
Understanding different cup and handle pattern variations helps traders make informed decisions. These variations can appear across different timeframes and market conditions. Here, we explore three common types:

Cup and Odd Handle
This pattern deviates slightly from the traditional form. The cup shape remains consistent, forming a rounded bottom. However, the handle appears irregular, often forming a downward or sideways channel. Traders should remain cautious with this pattern. The irregular handle can signal volatility or market uncertainty. Always confirm with additional indicators before making a trade.
Multi-Year Cup and Handle
The multi-year cup and handle pattern, which spans several years, offers significant long-term trading opportunities. The cup forms over an extended period, reflecting sustained accumulation and consolidation. The handle also takes time to develop, often lasting several months. This pattern indicates strong potential for a substantial breakout, rewarding patient investors. Use this pattern to identify stocks with long-term growth potential.
Intraday Cup and Handle
Active traders often spot the intraday cup and handle patterns. This variation forms within a single trading day, offering short-term trading opportunities. The cup and handle shapes remain consistent but develop quickly. Traders can leverage this pattern to capitalize on daily price movements. For optimal results, intraday traders should combine this pattern with real-time data and quick execution.
When Should You Use Cups and Handles for Trading?
The cup and handle pattern offers a reliable way to predict price movements. Understanding when to use this pattern helps traders make informed decisions. Here are five key scenarios:
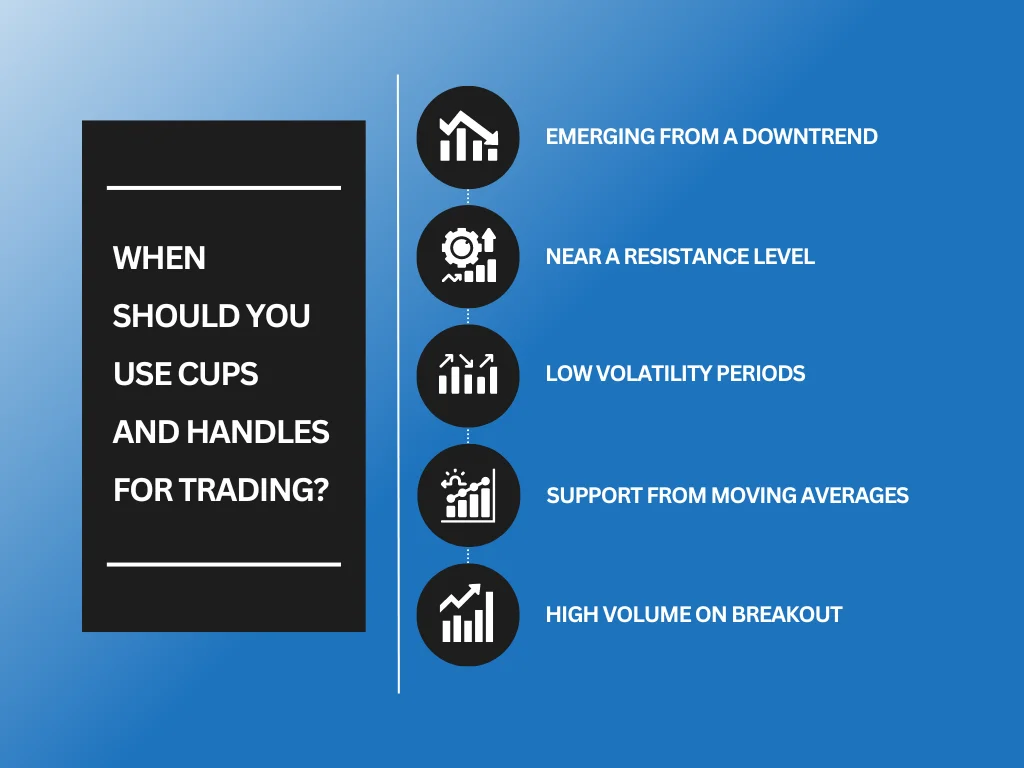
1. Emerging from a Downtrend
Traders should pay attention when a stock emerges from a downtrend and begins forming a cup. The bottom of the cup indicates a possible reversal point. Watch for a handle chart pattern forming after the cup. This pattern often signals the end of a downtrend and the start of an upside movement. The stock might consolidate near the moving average during this phase, creating a trading range. Using market data, identify the right top of the cup and the subsequent pullback.
2. Near a Resistance Level
A pattern becomes significant when it forms near resistance. The high forms at the top of the cup should approach an old point of resistance. If the price action breaks above this level, it indicates a strong bull run. Traders often use TradingView to monitor these levels. When the price exceeds the old highs, it confirms the pattern and suggests a higher price target.
3. Low Volatility Periods
The cup and handle pattern thrives during periods of low volatility. This pattern requires a calm market for the perfect pattern to develop. The stock experiences a rounded bottom during the cup formation, and the handle slightly declines before the breakout. Traders must monitor trendline movements closely. Using tools like Investor’s Business Daily helps track the series of articles on stocks with potential cups and handle formations.
4. Support from Moving Averages
When the stock price aligns with the moving average, it supports the pattern. The handle often forms above the moving average, indicating strength. The moving average acts as a support level, reducing the pullback risk. Traders look for stocks where the handle touches or stays above this average, signifying readiness for an upward move. The moving average provides a buffer against volatility, making the pattern more reliable.
5. High Volume on Breakout
A significant increase in volume during the breakout phase confirms the pattern. When the stock price breaks out from the handle with high volume, it validates the pattern. This surge indicates strong buying interest and predicts sustained upward movement. Traders use tools, such as volume indicators, to analyze volume trends. Confirming high volume during the breakout phase boosts confidence in the trade’s success and sets a clear price target.
Limitations of the Cup and Handle Pattern
The cup and handle pattern holds significant value in technical analysis, but traders must be aware of its limitations. Understanding these limitations ensures better decision-making and improves overall trading strategy.
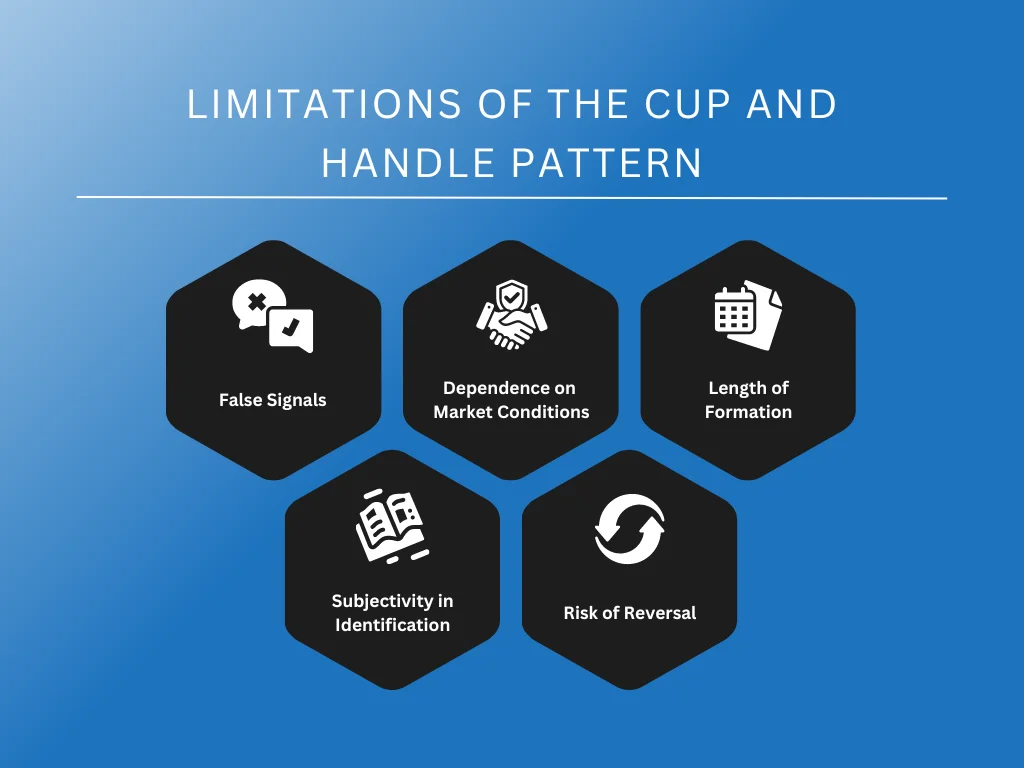
1. False Signals
The pattern often generates false signals. A false signal occurs when the pattern appears to form but fails to result in the expected price movement. This situation misleads traders into taking positions that do not yield profitable outcomes. False signals commonly arise in volatile markets with erratic and unpredictable price movements. Traders should use additional indicators, like a barchart, to compare stocks and confirm the validity of the pattern before making decisions.
2. Dependence on Market Conditions
The effectiveness of the cup and handle pattern heavily depends on market conditions. This pattern performs best in trending markets, either bullish or bearish. However, the pattern may not form correctly or produce the desired results in sideways or choppy markets.
Traders should always consider the broader market context and avoid relying solely on this pattern during uncertain market phases. Maintaining an option trade journal helps track the pattern’s performance in different market conditions, offering insights into its reliability.
3. Length of Formation
The pattern requires a significant amount of time to form. The cup formation alone can take several weeks to several months, and the handle formation adds additional time. This lengthy formation period can test a trader’s patience and tie up capital that could otherwise be used for other trading opportunities. Traders must balance their portfolios and ensure they are consistent with every pattern.
4. Subjectivity in Identification
Identifying the cup and handle pattern often involves subjectivity. Traders may interpret price movements differently, leading to inconsistent pattern identification. This subjectivity results in varied entry and exit points among traders, affecting the overall effectiveness of the pattern.
To minimize subjectivity, traders should set clear criteria for identifying the pattern, including specific measurements for the cup’s depth and the handle’s length. Comparing multiple charts can also aid in reducing subjectivity.
5. Risk of Reversal
Even when the pattern forms correctly, there remains a risk of reversal. External factors, such as economic news or market sentiment shifts, can cause prices to move contrary to the expectations set by the pattern. Traders must prepare for potential reversals by implementing risk management strategies. Setting stop-loss orders and diversifying investments helps mitigate the impact of unexpected market movements.
Key Takeaway
The cup and handle pattern is a powerful tool in technical analysis. It helps traders identify potential breakouts, making it a valuable addition to trading strategies. This pattern works best in solid market trends. Traders should look for a well-formed cup with a clear handle. Additional tools and support/resistance levels enhance the analysis, providing more accurate predictions.
Identifying and analyzing the cup and handle pattern helps improve your trading skills. Review historical charts, identify the pattern, and analyze the outcomes. This practice builds confidence and sharpens your ability to apply the pattern in real trading situations. It signals potential stock appreciation over time, making it a valuable tool for those focusing on long-term investment gains.
Curious how the cup and handle pattern fits your trading strategy? Spartan Trading offers expert guidance on identifying and utilizing this pattern. Subscribe to our newsletter for the latest insights, tips, and trading strategies. Start your journey to becoming a more skilled and confident trader today.